As we head to the #VALORANTChampions playoffs, here’s a look at who had the most kills per round in groups and the skin they did it with. @yayFPS leads, picking up .99 kills on average per round. He’s closely followed by @zekkenVAL, at an average of 0.97. pic.twitter.com/0flNbsNTvr
— Sam Rosenberg (@MasGrebnesor) September 9, 2022
Valorant
First Kill and Win Conversion: North America Last Chance Qualifier
This graphic details the percentage of rounds teams at the North America Last Chance Qualifier secured an opening kill. It plots that percentage against the winrate each team has in rounds where they get that opening pick. 100Thieves, the winners of the NA LCQ stood out as having an above-average number of rounds with first picks and converting nearly 80% of the time. The Guard, another finalist, had an around average conversion rate. But, they had the highest proportion of rounds with first kills in the tournament, with Sayaplayer leading the charge.
Another team that stands out is Sentinels, whose losses came against the finalists, with solidly average performances on both metrics. NRG, who also exited the tournament early, had a surprising stat line. NRG ended up with a massive 83% conversion rate on rounds where they picked up the first kill. While a low sample size is important to consider, NRG wasn’t very below average in the proportion of rounds with an opening kill.
NA LCQ First Blood Proportions
Credit: Valorant LCQ 2022 by Sam Rosenberg
The graphic above details the proportion of rounds players secured in the Last Chance Qualifier for North American Valorant. First Kills are crucial in trying to secure round wins, with the greatest entry players in the game being responsible for opening up rounds with critical picks. Tex had the highest percentage of the tournament, while Sayaplayer and Asuna led their respective grand finalist teams.
Phantom vs. Vandal in 2022 Pro Play
Below is a graphic using the most recent closed VCT event from each region to estimate the popularity of the two premier guns in the Valorant pro scene. Vandals still are the most popular, although just like 11 months ago, NA remains split on the issue.
Credit: Phantom vs. Vandal 2022 Challengers by Sam Rosenberg
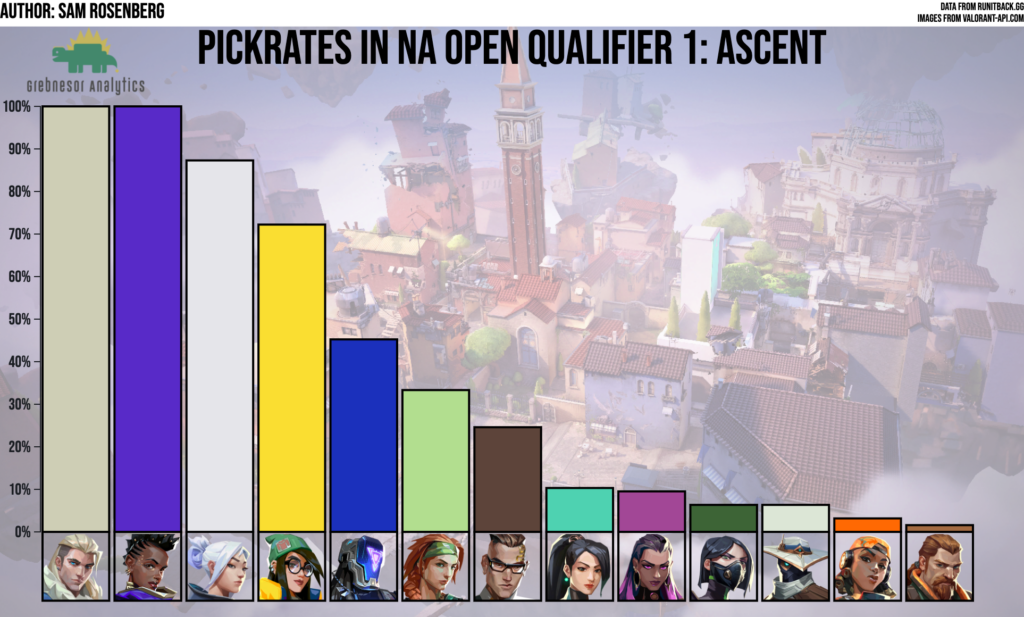
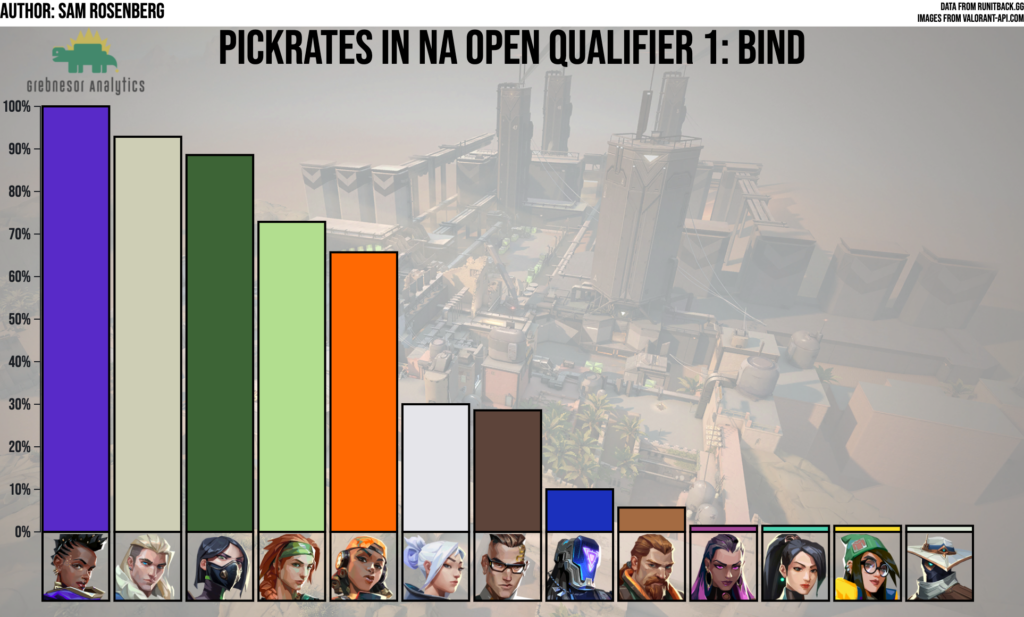
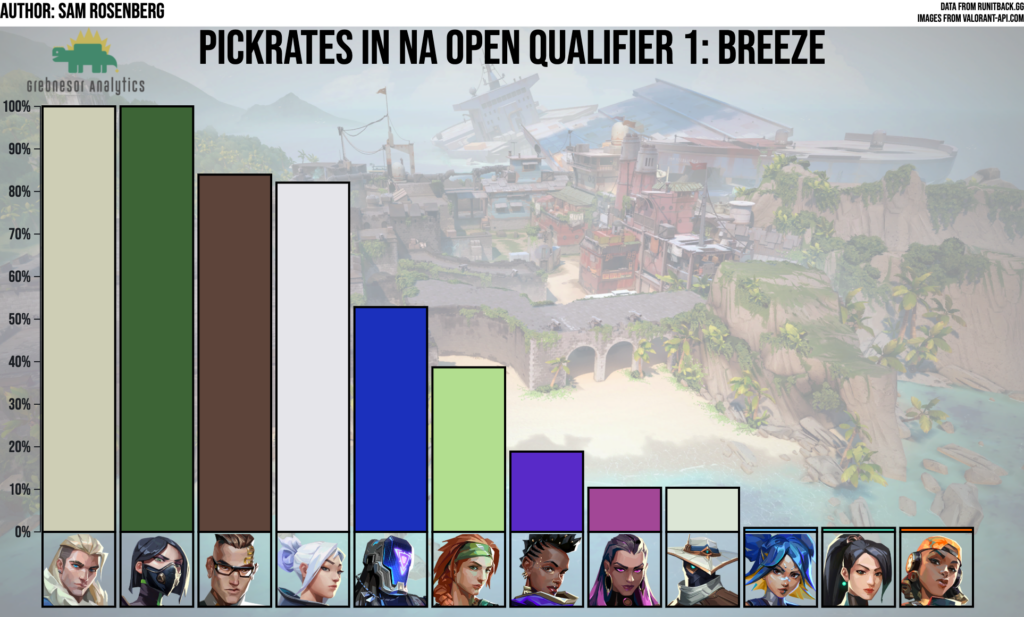
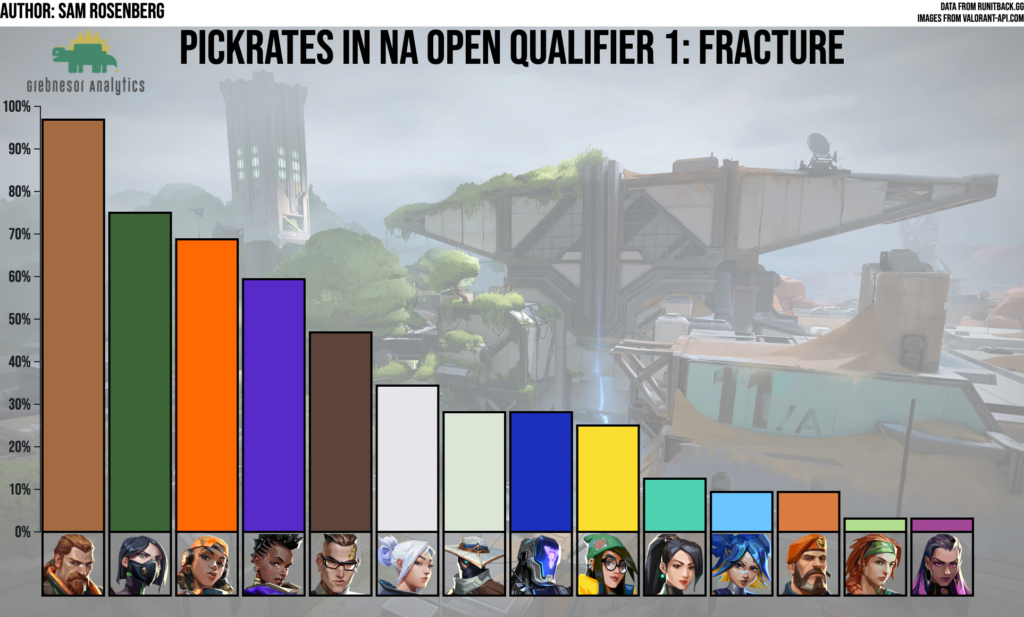
North American Open Qualifier 1 Agent Picks
Throughout the first open qualifier tournament of 2022, a number of agents stood in the spotlight. Across many maps, Astra and Sova were present, but the degree to which they dominated, and the agents that surrounded them, changed on a map by map basis. Below are graphics detailing the play rate of different heroes depending on which map was being played.
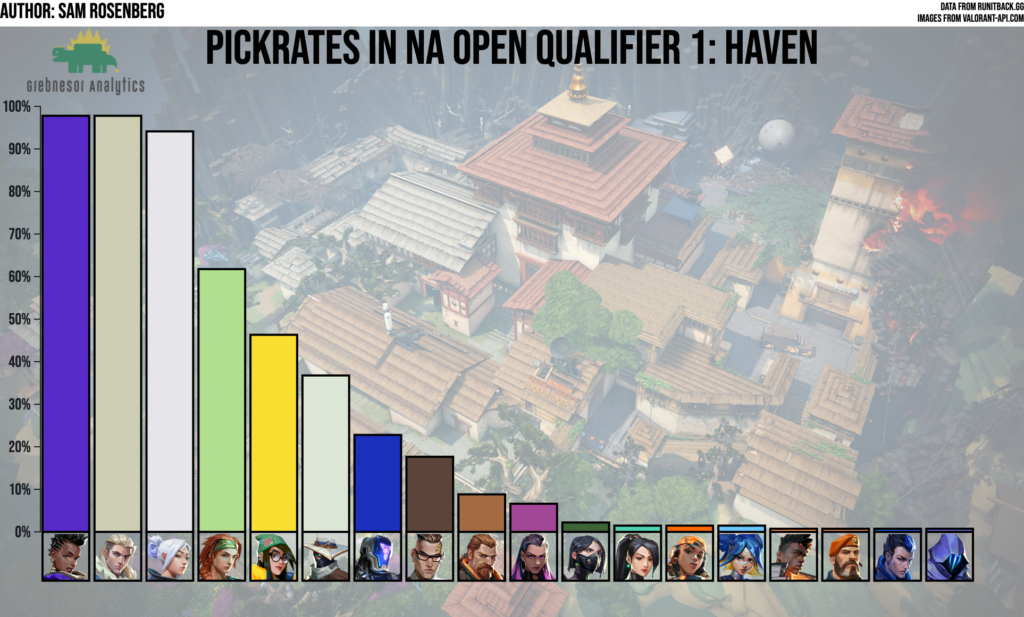
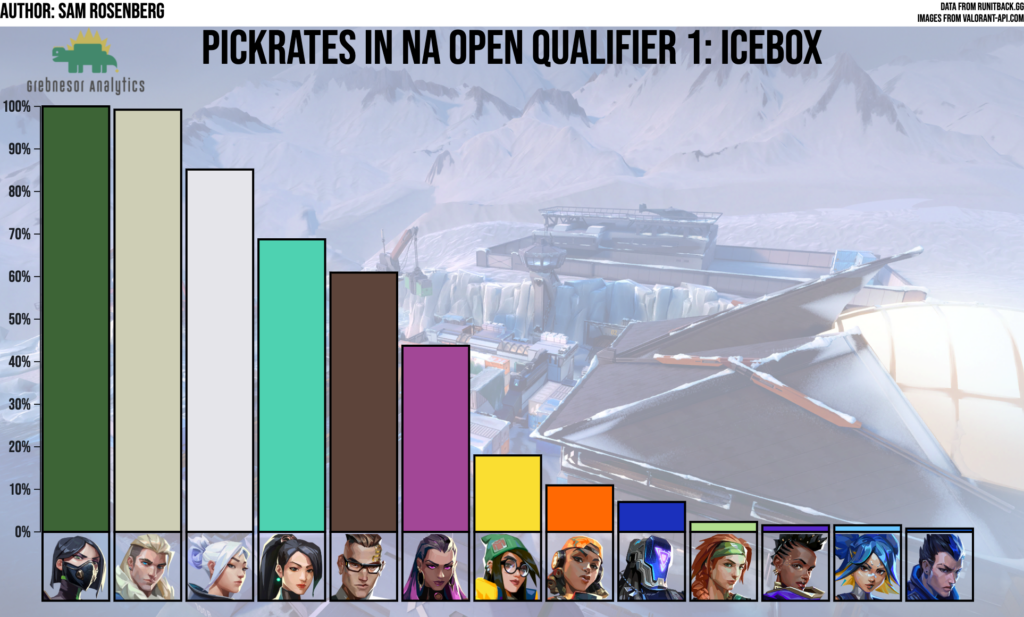
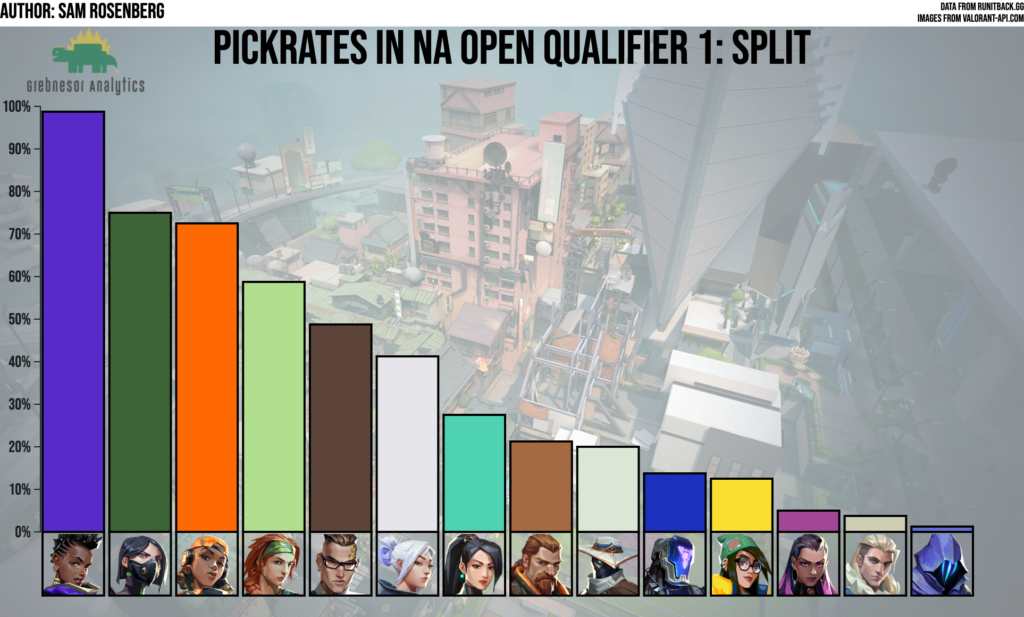
Is Fracture Attack or Defense Sided?
Inspired by Sideshow’s video at https://www.youtube.com/watch?v=rL84CDHfGqQ, I wanted to visualize whether teams were winning on Fracture more frequently on attack or defense as we head into champions. That graphic can be seen below:
